GET CERTIFICATE | GET PLACEMENT IN TOP COMPANIES
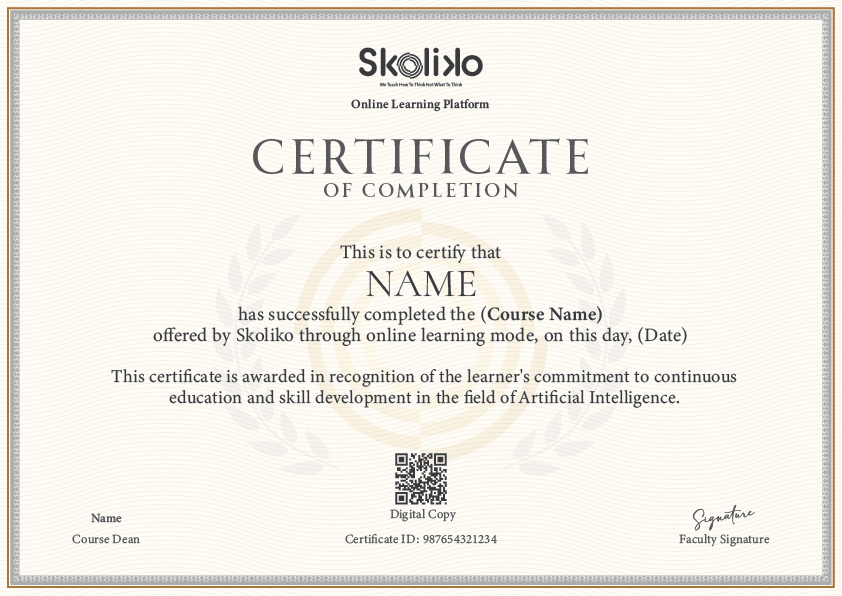
Upon successful completion of this course and all assessments, you'll earn a valuable certificate. This credential formally validates your newly acquired skills and knowledge, serving as a tangible testament to your dedication and achievement in this field.
SKOLIKO is an innovative leader in the education industry, committed to bridging the divide between academic and professional spheres.
Embrace change, pursue growth
relentlessly, and let your passion drive
| Course Overview
This hands-on course begins with foundational Power BI concepts and progresses to advanced techniques, ensuring a holistic learning experience.
Key modules include:
- Data Visualization: Build column charts, maps, matrices, and advanced visuals like Sankey charts and animated bar races.
- Power BI Service: Publish reports, collaborate with teams, and automate data refreshes.
- Power Query: Clean, merge, and transform data using text, date, and number functions.
- M Language: Write custom scripts to automate complex data transformations.
- Real-World Projects: Apply skills to industry-relevant scenarios, such as retail analytics or financial dashboards.
| Why Choose SKOLIKO?
Beyond technical skills, we focus on your career growth. Our blend of practical training, mentorship, and industry connections ensures you stand out in the competitive data analytics field.
| Why Does This Course Matter in 2025?
Power BI remains a cornerstone technology in business intelligence, with Microsoft continuously investing in its development. In 2025, as organizations grapple with ever-increasing data volumes, the demand for professionals who can transform this data into strategic insights has never been higher. With AI integration, cloud capabilities, and enhanced collaboration features, Power BI stands at the intersection of data science and business strategy—making these skills highly sought after by employers across industries.
According to recent industry reports, Power BI professionals command 15-20% higher salaries than counterparts with similar experience but without these specialized skills. As businesses increasingly adopt data-driven decision-making processes, Power BI expertise has become a differentiating factor in the job market.
| Who Is This Course For?
- Data analysts seeking to enhance their visualization capabilities
- Business intelligence professionals wanting to master Microsoft's BI ecosystem
- Project managers who need to create effective data reports
- Business professionals looking to make data-driven decisions
- IT professionals expanding their technical repertoire
- Career changers moving into data-focused roles
- Recent graduates aiming to build marketable technical skills
| The Next Steps After Completion
After completing this course, several paths are available to advance your career:
- Professional Certification: Prepare for and obtain Microsoft's Power BI certification to validate your skills
- Specialization: Focus on industry-specific applications of Power BI (finance, healthcare, marketing)
- Advanced Learning: Progress to advanced data modeling, DAX programming, or custom visual development
- Integration Skills: Learn to connect Power BI with other data platforms and services
- Career Advancement: Apply for senior data analyst, BI developer, or data visualization specialist roles
- Freelance Opportunities: Build a portfolio and offer Power BI consulting services
- Leadership Path: Combine with business knowledge to move toward data strategy or analytics management positions
SKOLIKO offers advanced courses and career counseling to help you navigate these options based on your career goals and interests.
Introduction

Basic Charts in Power BI

Working with Maps in Power BI

Working with Maps in Power BI

Tables and Matrix in Power BI

Exploring Additional Charts in Power BI

Exploring Cards and Filters in Power BI

Exploring Slicers in Power BI

Exploring Advanced Charting in Power BI

Enhancing Visuals with Objects in Power BI

Power BI Service Overview

Exploring Text Functions in Power Query

Exploring Date Functions in Power Query

Exploring Number Functions in Power Query

Merging Files in Power Query

File Merging

Condition-driven Columns in Power Query

Essential Power Query Topics (Power BI)

Exploring the M Language in Power Query

Course duration - 65 Hours
|Course day - every week "Saturday"
|Course time - 04:00pm to 07:30pm
Instructor

Vincent Thomas Varghese
Experienced TechnoStrategist
Experienced Technostragist with three decades in IT, excelling in Sales, Product Management, and Marketing across IT hardware, networking, and software. Proven strategic planner, startup pioneer, and mentor for large teams. Marketing authority in areas such as Business Incubation, Branding, and Sales. Vast industry expertise spans ITES, IT Hardware, IT Training (Software), Distribution, and Retail. Recognized for interpersonal leadership, intuitive decision-making, and a collaborative approach. Complemented by four years as a Data Scientist, enhancing analytical and problem-solving skills with a deep passion for coding and a knack for simplifying complex concepts,


